

Everyone agrees on
Sales, finance and ops finally seeing the same number for the same word.
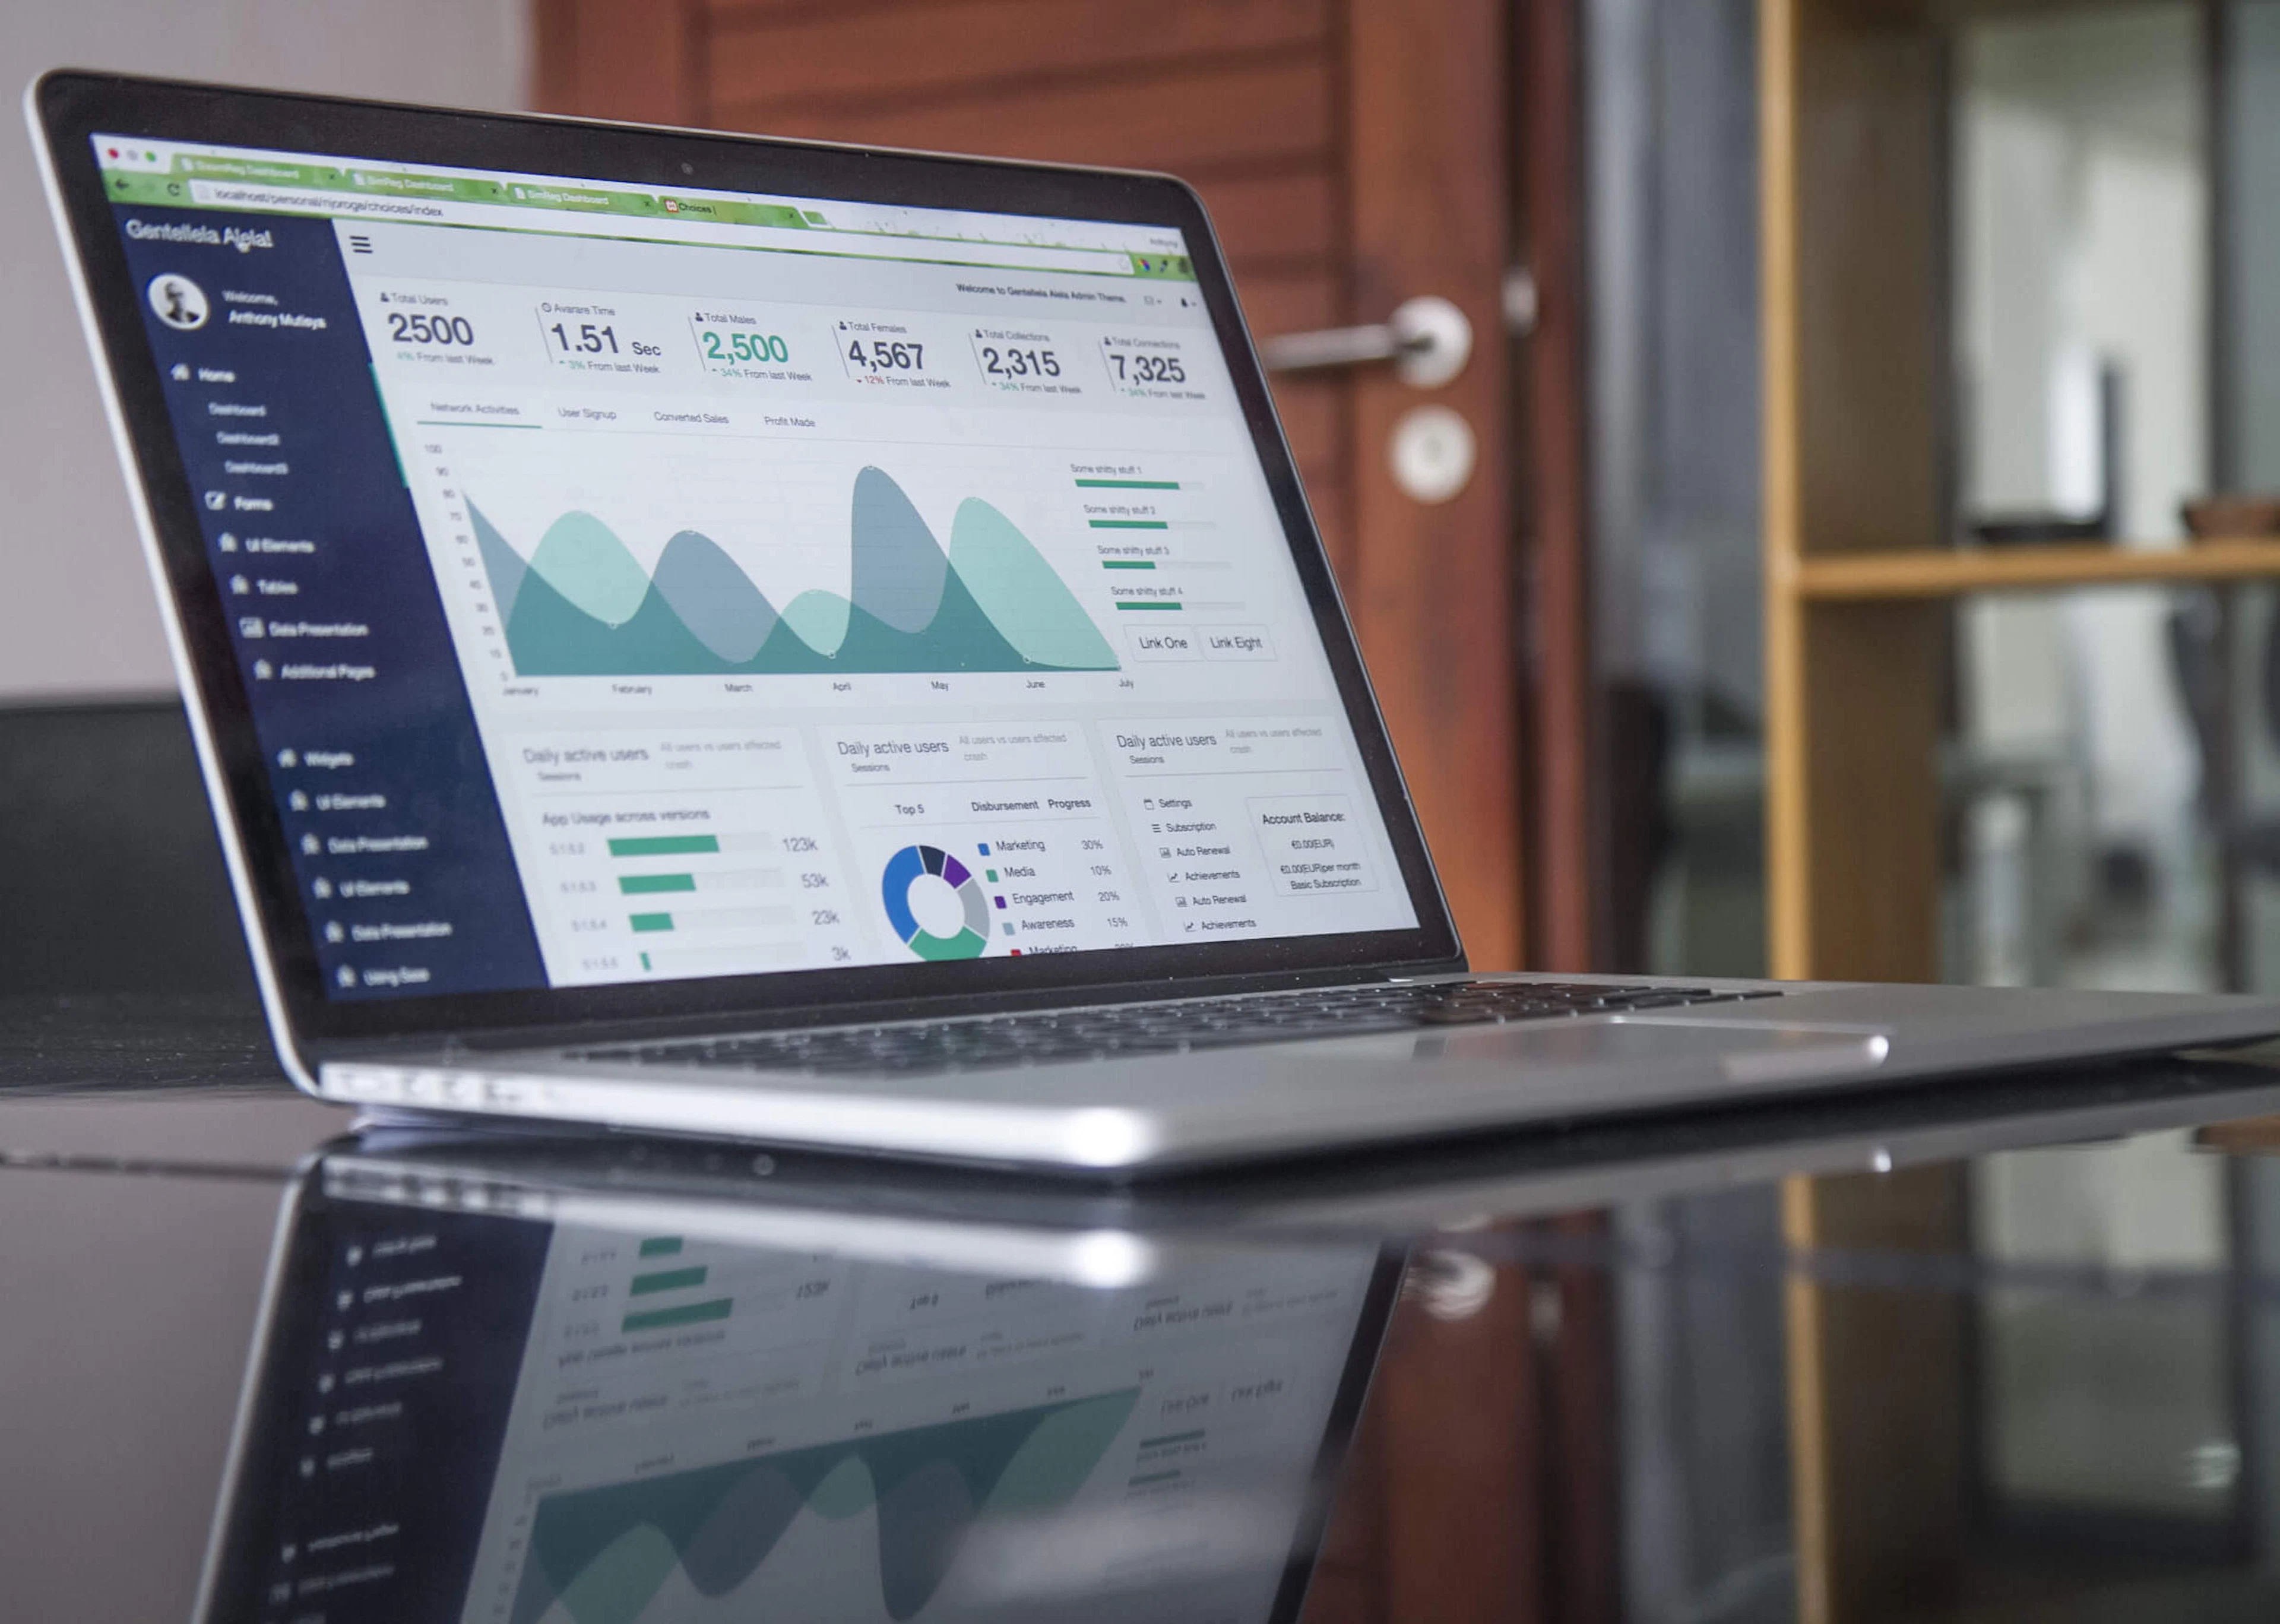
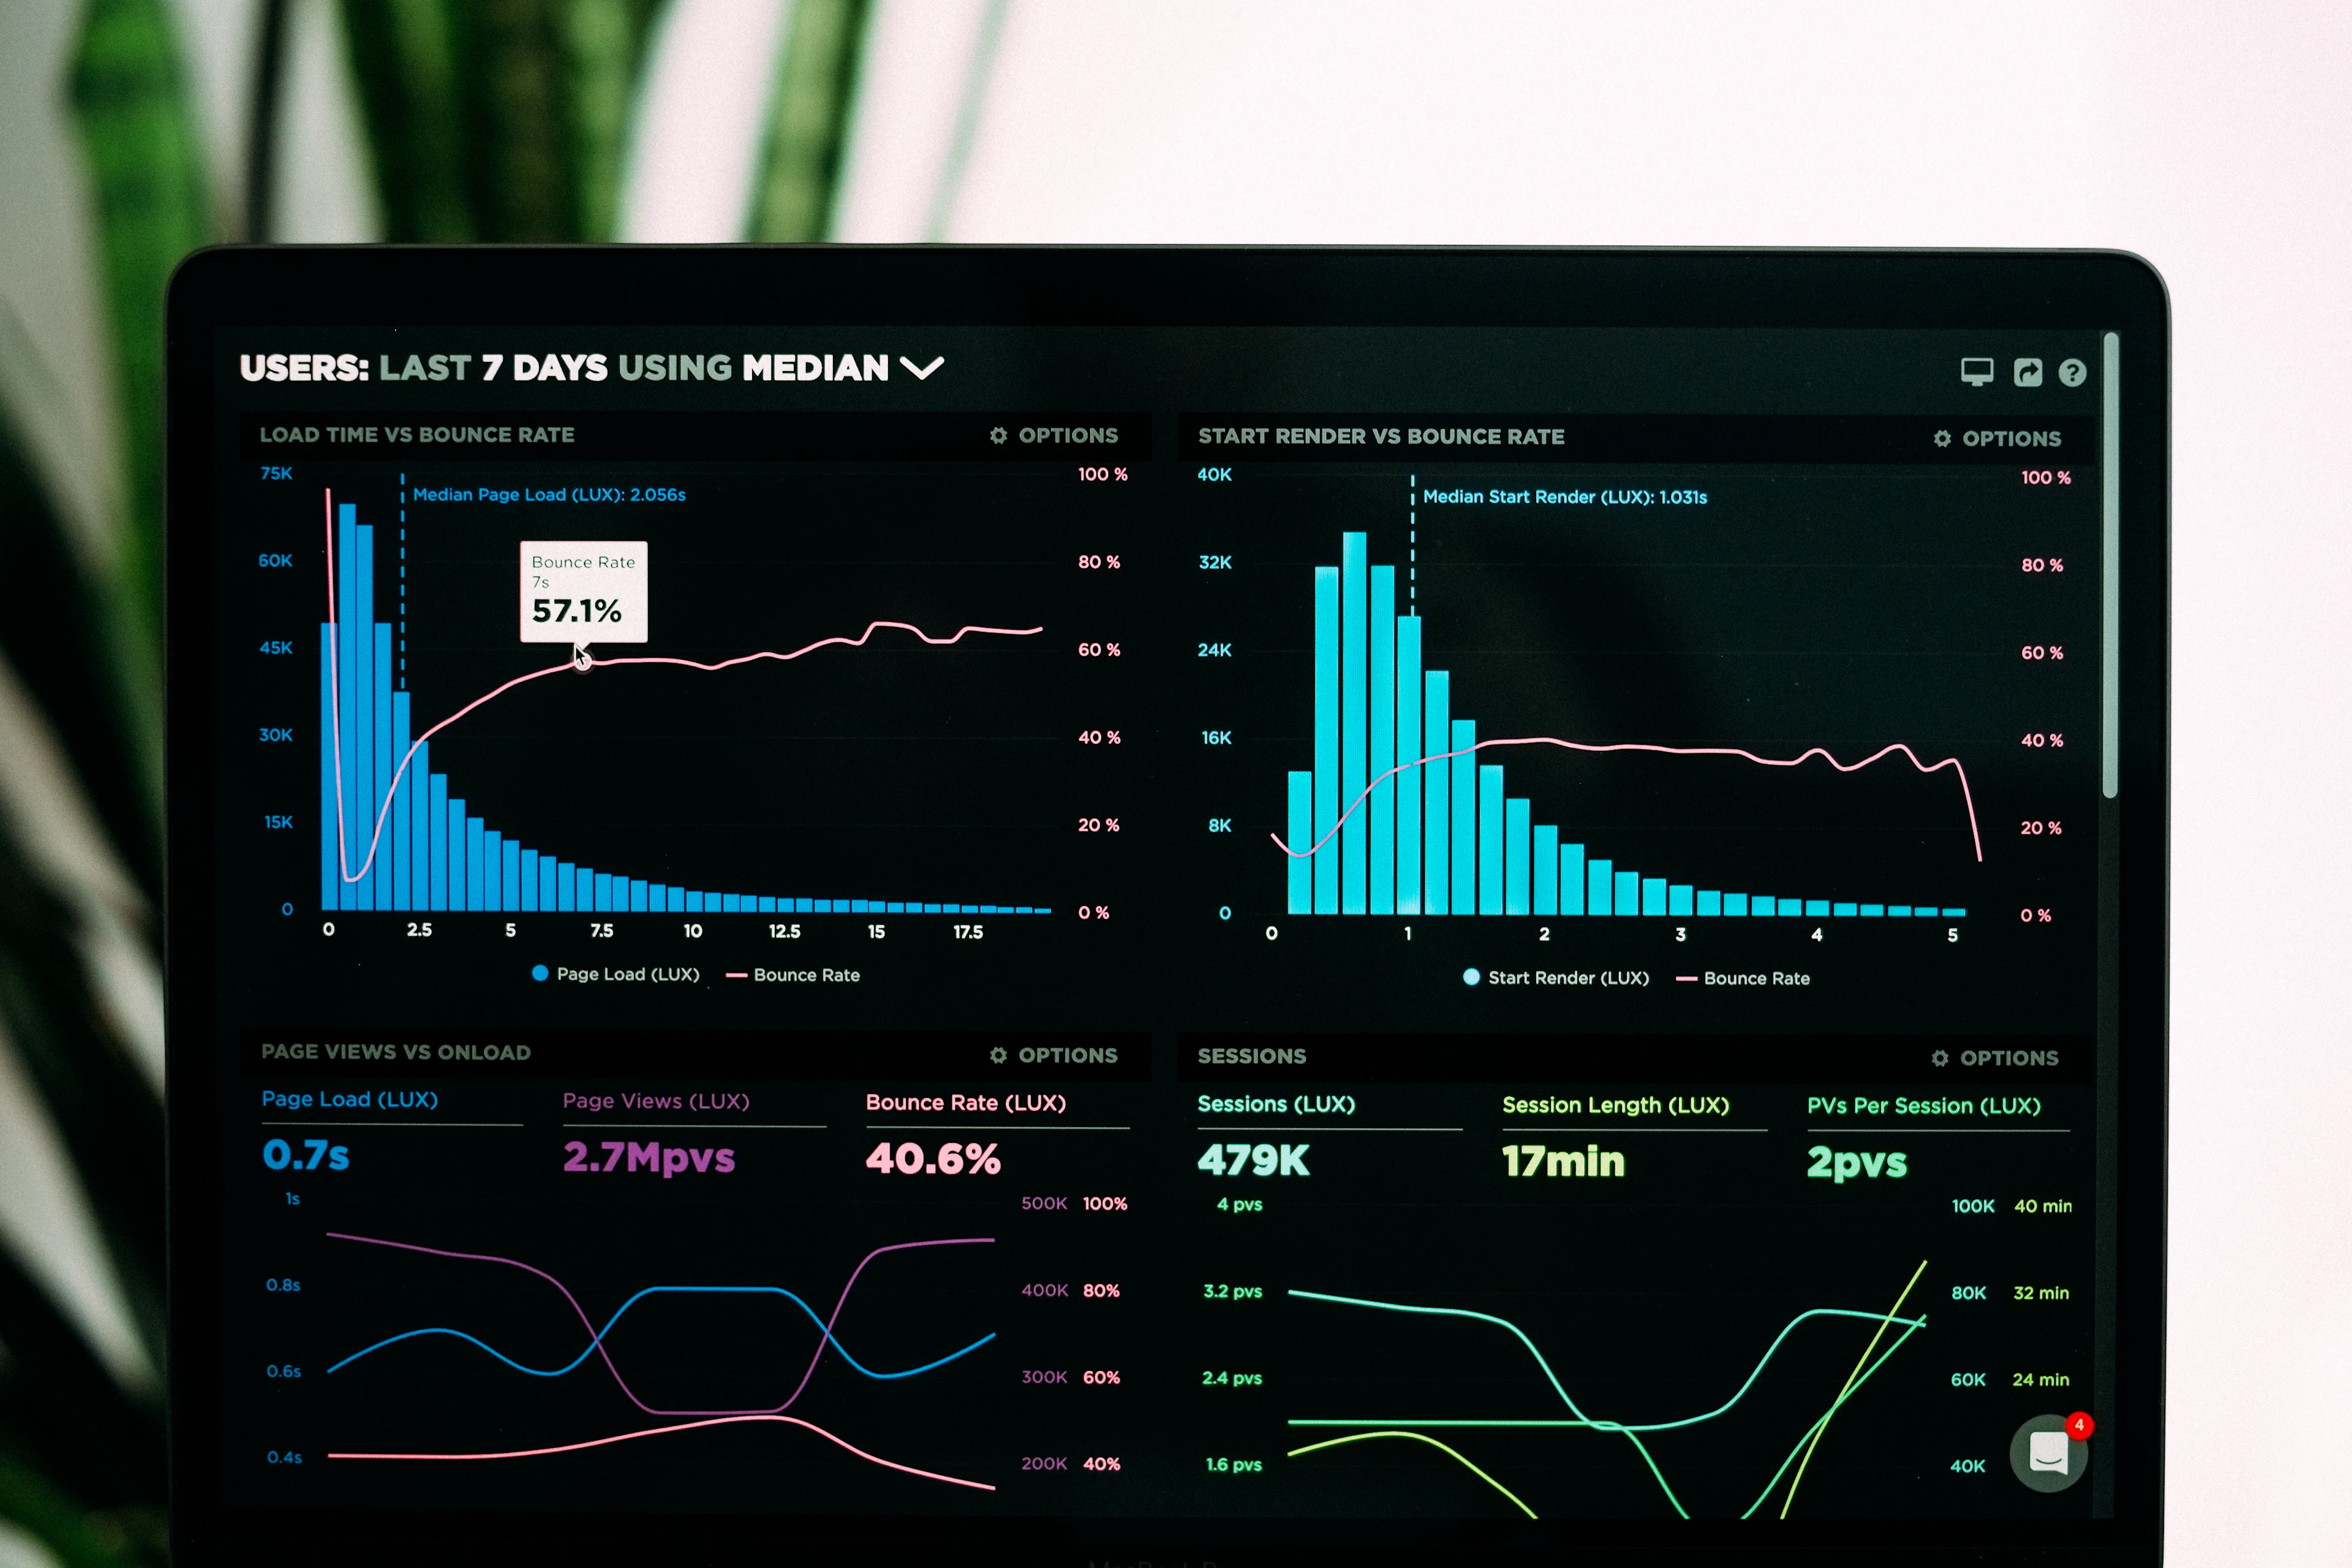
One trusted data model, three dashboards, decisions made faster.
Every business we work with has more data than they realise, in their POS, their CRM, their accounting package, their delivery app, their WhatsApp inbox. The problem is rarely a shortage of numbers. It is that the numbers live in seven systems that disagree with each other, and nobody trusts the report enough to act on it.
Our analytics work starts with picking three decisions your leadership needs to make better, and tracing back to the data those decisions need. We then build one model, usually in dbt or Python, that everyone in the business can agree is the source of truth. Dashboards come last, not first. Three of them, each for a role and a decision.
Once the foundation is in place, automation gets cheap. Stock reordering, invoice chasing, KYC checks, daily ops reports, the obvious wins start paying back within weeks.
Fixed scope, fixed budget. If something new comes up mid-engagement, we re-scope in writing before it lands on an invoice. No surprises, no hidden line items.
Sales, operations, finance and customer-success views, each one built for a specific role and a real decision.
Charts that tell a story in five seconds, not interactive toys that take an hour to explore.
Automated daily, weekly and monthly reports straight to email, Slack or WhatsApp.
Quiet automations between your existing tools, Sheets, Sage, M-PESA, CRM, accounting, that remove human copy-paste work.
LLM-powered triage, summarisation and document extraction wired into your real workflows.
Lead-time, fulfilment, churn, NPS and SLA tracking with proactive alerts when something drifts.
Sales, finance and ops finally seeing the same number for the same word.
One per role. Read in five seconds. Actioned the same day.
Typical recovery from removing manual report-building in the first month.
Every system that produces data is catalogued and scored for trust, completeness and freshness.
A dbt or Python project that produces the metrics everyone in the business agrees on.
Three dashboards, not thirty, each one for a specific role and a specific decision.
One hour each month to tune the model based on what is actually being used and what is gathering dust.
Daily stock-and-margin dashboard for a Nairobi supermarket chain, pulling from POS, suppliers and accounting.
Fleet utilisation and fuel-cost analytics for a cross-border haulier serving the Northern Corridor.
Patient-throughput and revenue-cycle dashboard for a private clinic group across three counties.
Loan portfolio quality, arrears and PAR-30 tracking for a SACCO with 40,000 members.
Usually not. We pick the smallest infrastructure that works, sometimes a single Postgres database with views is plenty. Warehouses earn their keep above a certain volume; below that they are overkill.
Yes. Most of our automation work sits between the tools you already use, Sheets, Sage, your CRM, M-PESA, WhatsApp. We rarely need to replace the underlying systems.
We sign NDAs, we work in your environment when you prefer, and we follow the Data Protection Act 2019 for any personal data. We can also align to your ISO or SOC posture if you have one.
One business day. Written plan. Fixed budget. No PDFs in a fortnight, no exploratory calls in disguise.